I found the combination of long stochastic 30,60,30 and dynamic cycle indicator so rewarding so far. The two combined together in the H4 defines a profitable intra-day trend.
Its has been range bound market for two weeks now for AUDUSD. Although the major trend from the D1 is uptrend since MAY 19, but showing a signal of over-bought market in the D1 and two weeks whipsaw withing the eange 0.6963 and 0.6819 The H4 pattern shows the trend will support north move and waiting on the oscillator in H4 to turn GREEN and buy opportunity may set in. This is sure as long as the H4 Trend indicator remain BLUE (uptrend). THis is possible in the ealy days of the week.
The EURJPY was a good move to the south today. Trend trailed from Monthly to Weekly and the Daily time-frame for entry. The market moved south so quickly. Since the Trend is still very much to the south - considering the monthly and weekly bear pressure, the B image shows expectations in the up coming weeks. The down trend can still be taken advantage of. We have some patience to wait on the oscillators to be in shape. Its going to be a good trend.
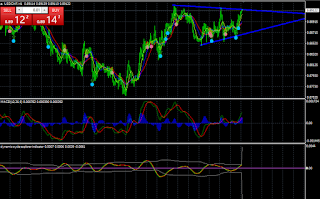
The bullish run in the past few D1 and H4 candles is clear using MACD CFX. The D1 and H4 is prepared for BUY but the followings we must carefully consider: - USDCHF current price is making triple tops and that may be a major resistant zone. - The DCI oscillator is overbought in M30 so we need to wait for it to relax to the oversold levels for a BUY signal to make sense. I will be BUYing when the DCI is bullish from below the middle levels in M30 or H1 timeframe


Comments
Post a Comment