Posts

Showing posts from 2020

EURUSD - BEARS IN CONTROL

Image
 The trend obviously reversed in the medium term  (H4 timeframe). The TMSAlope, price pattern and posision of the market cycle sugest bearish only for now. The dynamic trend explorer is over sold and one may expect a minor rally in few days or early part of next week. As long as this pattern remains, the trend is down. Will be good to wait for a good opportunity to BUY when the oscillator goes above the middle level.

EURUSD - USDCHF MARKET INSIGHT

Image
 This pattern in the Daily timeframe shows a strong trend under way for EURUSD and USDCHF. The two oscillators in the daily timeframes shows uptrend (EURUSD) and down trend (USDCHF).  The H1 TMASlope (TMA for triangular moving average) must support the trend for good opportunity for trade entries in the near future using the oscillator in M30 or M15 timeframes.

AUDUSD - BUY SIGNAL

Image
 The Hammer candle sitting on 50% fibonacci level means alot. At this point the dynamic cycle explorer is ready for an uptrend and the momentum matrix indicator is also set for a BULL market. BUY signal here at 0.7281 for 30-40 pips. Other intra-day levels

CHFJPY - MARKET INSIGHT

Image
 The CHFJPY like other pairs against the JPY is bullish considering the alligator indicator. Default stochastic is now weak on the minor downtrend spotted on the D1 timeframe. This is a good time to plan entry for possible BUY. The H4 Dynamic Cycle Explorer oscillator is ready and good entry right now for some 20-50 pips. Intra-day levels below:

EURJPY - TECHNICAL INSIGHT

Image
 H4 timeframe for EURJPY is clear down-trend at the moment. The momentum indicator - wrapped with SMA trend meter shows the market is weak doing up. The major oscillator (Dynamic Cycle Explorer is at the over bought ZONE. Sell signal in the M30 is good for sell below the support levels 125.35 and below 125.99

CADJPY - Market Insight

Image
CADJPY is strong uptrend from the Daily timeframe, considering the arrangement of 21,14 and 7 SMAs and Dynamic Cycle Explore confirming that in same timeframe. The major intraday support are 80.08 and 70.90 and this pair is good for BUY as long as price is above this supports.

BULLISH DIVERGENCE

Image
The bullish trend of the TMASlope is backed or confirmed by the bullish (hidden) divergence as seen in the image below. Price is sitting on the intra-day support at 138.77. Another support at 138.08. We continue with the bullish bias as long as price is above the support levels.

MARKET INSIGHT

Image
 Two pairs appeared on my scan result this morning as potentials this week. The DSS, fisher and dynamic oscillators in weekly timeframes are all in uptrend. D1 shows confirmation with dynamic cycle explorer going up too. H4 below the middle level for dynamic cyle explorer triggers an opportunity to plan BUY.

AUDJPY - TECHNICAL INSIGHT

Image
 Strong D1 timeframe BUY signal here as the fisher and DSS indicators remain bullish. H4 timeframe's dynamic cycle explore indicator is also bullish to confirm the bias. Price above 76.44  is good to think BUY and prefer to BUY now with M30 oscillator over-sold.

GBPUSD - BUY SIGNAL

Image
Its a good BUY for GBPUSD at this point. W1 timeframe shows a very strong uptrend with the three indicators and H4 dynamic cycle seems to show a fresh BUY signal from over sold zone. The price levels are also updated in this post.

USDCAD - TECHNICAL INSIGHT

Image
 I did a quick SELL of the USDCAD. The trend on the W1 is clearly down (as seen on fisher and short DSS). H4 dynamic cycle also fresh SELL from above the middle line. I had to leave the market on-time as the D1 oscillator is no more trust-worthy to the down side.

GBPUSD TECHNICAL INSIGHT

Image
 This is more like a head-and-shoulder pattern. Ok considering the weekly timeframe indicator setup the trend for the GBPUSD remains bullish. To find trade opportunity for BUY in the dip as seen in H4, one should wait for a piercing pattern - a bullush H4 candle that will close above the body of the previous candle.  The dynamic cycle oscillator is set for BUY but its good to wait on the chart pattern mentioned above. This is important as the D1 dynamic cycle oscillator is bearish at the moment. Its important to note the price levels (support and resistant). But opportunity should be safe above the level 1.3018.

GBPCHF - BUY SIGNAL

Image
I dont trade this pair often especially because of the spread for me on the high side.But the buy signal coming this time for 30pips less the spread I might still have some 20+ pips. Not bad The D1 fisher is bullish and the Daily DSS 4,7  over sold in an uptrend in D1. In this pattern I will need a rising BULLISH signal in lower time-frame. I can see that in the M30 TMASlope rising to a fresh BULL market signal.

USDJPY - BUY SIGNAL

Image
The indicators in the D1 shows buy pressure. Fisher bullish together with the tiny noisy oscillator DSS. The H4 Dynamic cycle is fresh BUY and this is good for intra-day BUY. H1 is not ready for BUY and expect that soon. I am in with lighter lots since the M30 and M15 indicators are fully bullish at the moment.

DARK CLOUD - NZDJPY

Image
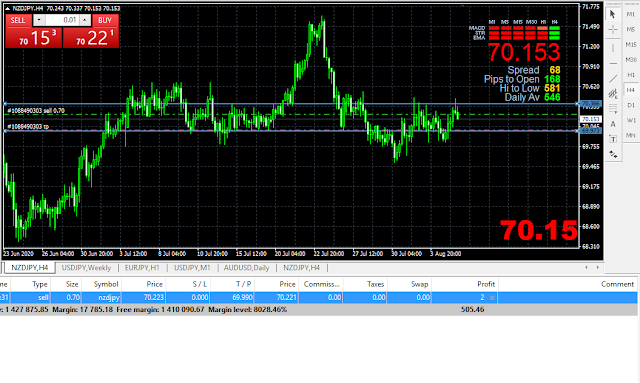
Dark cloud of such in H4 in a bearish H1 TMASlope condition I would love to take. Selling from this resistant zone below 70.37 for a 30-40pips or targing a support near 69.99.

CFX ACADEMY: EURJPY BUY SIGNAL

Image
The EURJPY had a sharp dip this morning and bounced from the intra-day support at 124.24 Daily timeframe fisher trend still uptrend and the dip opened up BUY opportunity well taken. H4 fisher going bullish may still present more opportunity to BUY using the M30 dynamic cycle indicator.

USDCAD SPIKE DOWN

Image
It took me a while to get on s SELL. W1 short DSS oscillator is bearish together with default fisher. The sell signal came up with D1 short DSS above the middle level and the H4 oreoared to sell. The long intra-day whipsaw was discounraging. Profit hit in a short time as I made the entry. Done for the week.

NZDUSD BUY SIGNAL (UPDATE)

Image
This pair sometimes too slow for me. The market condition is bullish for intra-day and the H4 and interestingly the D1 both has a weak oscillator reading for SELL. I will consider a BUY above the intra-day support at 0.6624. the S/R levels are attached to this post ======= UPDATE =======

GBPJPY - QUICKER THAN EXPECTED

Image
The profit archived earlier than expected and I want to say one more opportunity may show up tomorrow next trading day. That should be monitored in the M30 timeframe and I may not post a review of this but focus on another pair. The account is about 27% up in two weeks and audited by MQL5. Click the menu icon to view the performance history. Training on this trading plan is tomorrow. Register if you are not already in. There is alot to learn

GBPJPY - BUY SIGNAL

Image
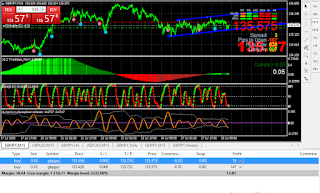
It was quick yesterday I did a buy limit and that hit profit real quick and still have a lighter lot size position running. This point is good time to consider a BUY for GBPJPY. The H4 oscillator is weak for any major SELL considering the position of the major oscillator in H4. M15 Triangular Moving average Slope Indicator is fresh uptrend signal. Its good to make a buy above 135.33 support level targeting the next intra-day resistant at 135.78 and if possible above and beyond.

AUDJPY

Image
The AUDJPY from my desk I will BUY as soon as the H4 oscillator goes bullish. The W1 trend is up and weak minor trend in H4 means its time to start thinking BUY.

USDCAD - FOCUS

Image
Good to monitor how USDCAD will unfold in the next few hours today. The downtrend last week as seen in the D1 timeframe may present another opportunity to sell again later this week. This pair is sitting on a support though one will expect a minor rally up. I will like to wait on the H1 oscillator to give a sell signal from above the middle level for another SELL trade for this pair.

GBPJPY MY FOCUS

Image
The GBPJPY may signal a BUY later today. The D1 uptrend with the fisher indicator going full green and the correction in the H4, its time to wait on an entry in the intra-day timeframes. H1 oscillator here is overbought. It is wise to wait for the dynamic cycle oscillator to go down the middle level. If all the uptrend conditions in the higher timeframes still in place then its good to go BUY.
GBPUSD - SIGNAL AHEAD

Image
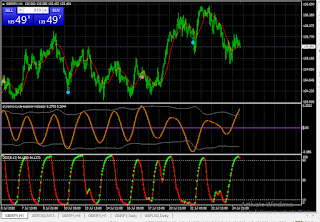
GBPUSD has been on the rise breaking all the last week's intra-day resistant prices.Recent resistant turned Support is at 1.2765.  The H1 oscillator is over bought and it is good to wait for a pull-back of market or for the H1 oscillator to relax below the middle level for another BUY signal (provided the uptrend conditions of the market still in place).